Body Proportions, height, body parts, bones, and Egyptian art
Overview
Learners measure body parts and compare their ratios to height and the use of ratio in Egyptian art , Greek sculpture and more. Learners can explore proportion of body parts and a person's height with diagrams, scatter plots, graphs, and regression lines.
Focus questions
- Are body parts proportional to a person's height?
- Do different peoples body parts have the same proportions?
- In other words is the length of my arm one-half my height?
- Is it the same for other people?
- How did the ancient Egyptians use proportions and a grid system to draw their art?
Body part measurements and height activity
Procedure
- Measure a variety of body parts for several people and record the data in a table.
- Include the ulna bone. With your arm stretched out from your body and thumb pointing to your right, measure from the bump on the inside of your arm below your wrist along the inside of the arm to where it ends with the bump it makes at your elbow. You can use it to compare to your height and other body parts and later to average ulna bone to height equation.
- Record your data along with other classmates in a table.
Body data
Person Measured |
Height | Ulna bone | Body part from _______ to _______ |
Body part from _______ to _______ |
Body part from _______ to _______ |
Body part from _______ to _______ |
|---|---|---|---|---|---|---|
Review the class data. Is there any body part that seems most likely to be proportional for all the people in your collection of data? For example is a person's height divided by the length of one body part get approximately the same result for most of the data?
What formulas did your data suggest?
What might suggest discrepancies?
What arguments can be made for and against using only one measurement?
Graphing class data for one body part and height.
- Select a promising set of data to graph. A set of data that has predictive potential.
- For example if the arm length looks to be proportional to the height, graph the arm length as the independent variable or manipulated variable or x. If necessary, see review graph fact sheet, against the height (dependent variable, responding variable, or y).
- Draw a line that is as close as possible to as many of the data points. (Regression line)
- What does the line represent? the relationship of bone length to height.
- The closer all the data points are to the line, the better the predictive value of the relationship.
- The equation of the line, can be found with linear regression software, if available.
- Decide if the data are or are not proportional, and explain the reasoning used to arrive at the conclusion for the set of data used.
Real world applications
A Malnutrition Universal Screening Tool (MUST) uses these formulas.
- Men: Predicted height cm = 79.2 + (3.60 · ulna length cm)
- Women: Predicted height cm = 95.6 + (2.77 · ulna length (cm)
The Malnutrition Universal Screening Tool (MUST) requires height and weight measurements to calculate the Body Mass Index (BMI) as its first step. When a person is unable to stand, is bedridden, or has spinal deformities that make accurate height measurement impossible, alternative methods like measuring ulna (forearm) length are used to estimate height.
The formulas provided are specific regression equations developed for use in adults under 65 years old in the UK population to predict height from ulna length:
Men: Predicted height cm = 79.2 + (3.60 · ulna length cm)
The resulting estimated height (in meters) and the patient's weight (in kilograms) are then used in the standard BMI formula to determine the BMI score component of the MUST
The Malnutrition Universal Screening Tool (MUST) is widely used and validated for use in all adults across various care settings (hospital, community, care homes).
It is considered reliable and effective in identifying malnutrition risk in the general adult population. However, the tool has faced scrutiny regarding its reliance on Body Mass Index (BMI) as a key component, as BMI cut-offs may not be universally applicable across different ethnic groups due to variations in body composition and health risks at the same BMI.
Other applications
While there is variation in averages between males and females and across ethnic groups, Calculations for the ulna and other bones: humerus, radius, femur, tibia are available at this source along with a CSI investigation plan and worksheets.
Egyptian art
Early Egyptians sorta discovered the idea of body parts being proportional and used it in their art. For example, to draw people they could used proportions and a grid to draw people. Explore the grid example, from an ancient artifact and see how it compares to modern humans.
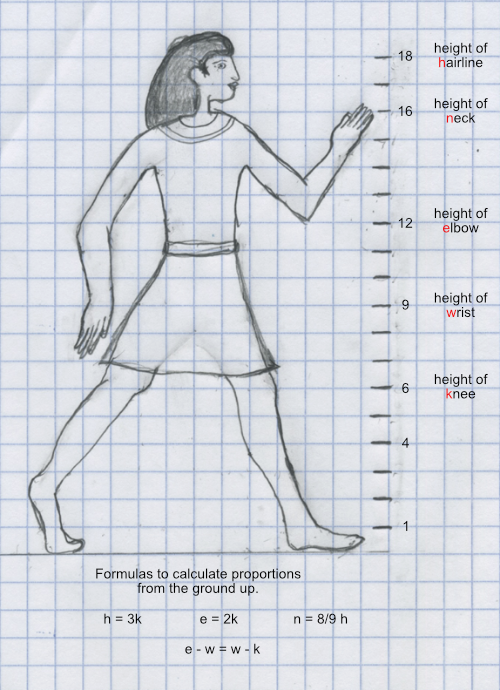
How do the proportions compare to the measurements in the activity body part measurements?
More examples
Greek sculpture, Doryphoros of Polykleitos, wrote a book titled: Canon about 540 BCE. In it he recorded his ideas on the ideal proportions of the human body. His measurements started at the top of the head as zero and go to the bottom of the foot: Source
- 0 - top of head
- 1 - bottom of the chin
- 2 - middle of breast
- 3 - top of pelvis
- 4 - bottom of ischium bone
- 5 - above knee
- 6 - mid calf
- 7 - inside ankle bone
- 7 1/2 - bottom of foot
He also included horse body part ratios.
What about proportions for the Barbie doll, Comic superheroes, different sports, fashion models, ...