Linear equations
A linear (linear) equation can be represented in the forms
y = mx + b
and
m1x1 + ... + minx + b = 0
- x and y are variables (values that can change)
- m and b are coefficients (numbers in an equation that don't change)
One way to solve a linear equation is to substitute values for x and solve.
For example:
If m is 2 and b is 0, then the equations would be (2x + 0) and we would substitute
(0, 1, 2, 3, ...) for x in the equation; or for each addend in the sequence of the function
m1x1 + ... + minx + b = 0
Substituting will yield the positive values: 0, 0; 1, 2; 2, 4; 3, 6; ... and substituting: -1, -2, -3, ... will yield negative values: -1, -2; -2, -4; -3 -6; ... )
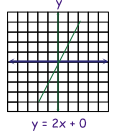
These pairs can plotted on a Cartesian coordinate graph (x, y), connected with a line to represent it. The green line on the graph below represents the linear equation for
y = 2x + o
Let's explore how the line changes when m changes.
Slope and graphing
When the form of the equation is y = mx + b, m represents the slope or angle of the line.
Let's explore three equations where the value of m changes from 1/2, to 1, to 2.
First, plot the line for the equation y = 1x + 0.
The red line represents this equation (y = 1x + 0) on the graphs below.
- It has a slope of one.
- Notice each pair is increased by one: -3,-3; -2,-2; -1,-1; 0,0; 1,1; 2,2; 3,3.
- Or it can be said each pair on the graph is one up and one over from the previous.
- Also the line is oriented at 45 degrees on the graph.
This is useful to know as we can use it as a reference to visualize different slopes.
Examples:
- For the equation y = 2x + 0 and a slope of 2, the green line slopes more than the red line with a slope of 1. Also each point is one over and two up from the previous.
- For the equation y = 1/2x + 0 and a slope of 1/2, the purple line slopes less than the red line with a slope of 1. Also each point is two over and one up from the previous.

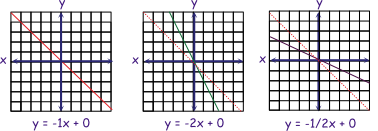
Notice all of the examples slope up to the right, or are positive slopes. Slopes, which are down to the right are negative.
Here are some examples with negative slopes?
First, let's explore how the line changes when b changes.
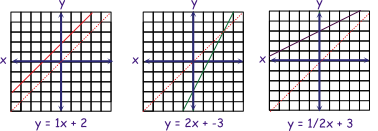
Y intercept
b is the y intercept (where the line crosses the y axis. In the examples so far b has had a value of zero and all the lines intersect the y axis at zero. Let's look at some example that don't. From left to right the y intercepts are: +2, -2, and 3.