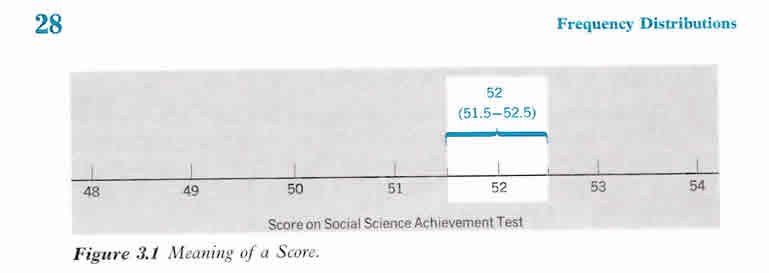
Frequency distribution examples with charts and graphs; Central tendency; Percentiles; and Correlations
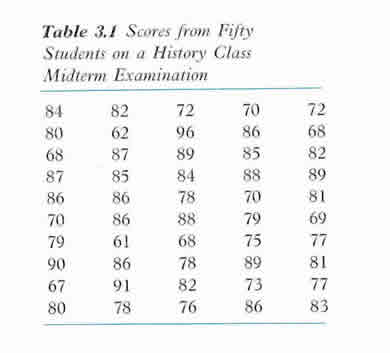
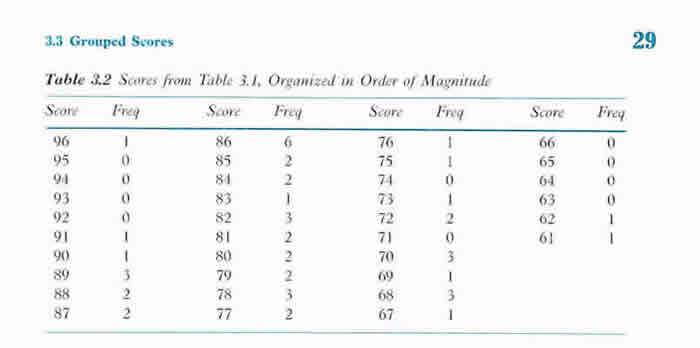
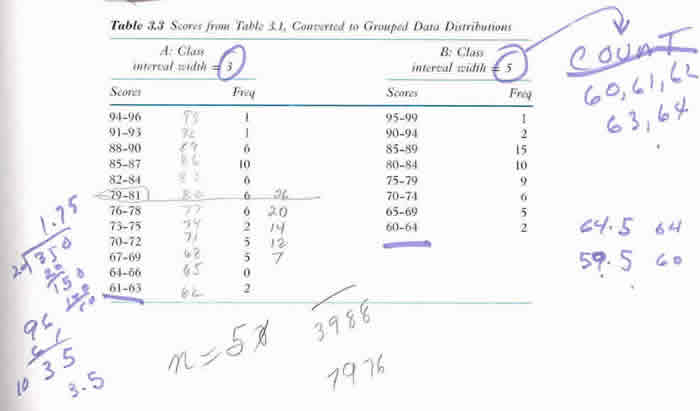
History Midterm for fifty students - scores and frequency distributions
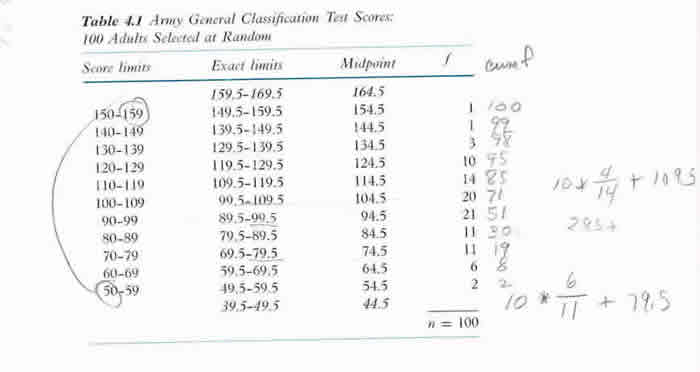
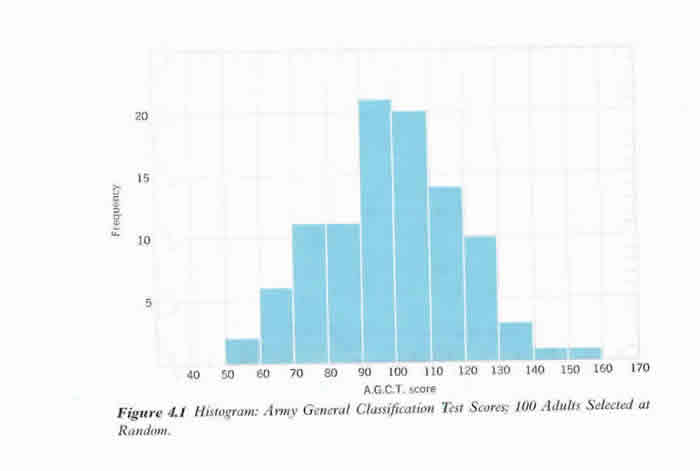
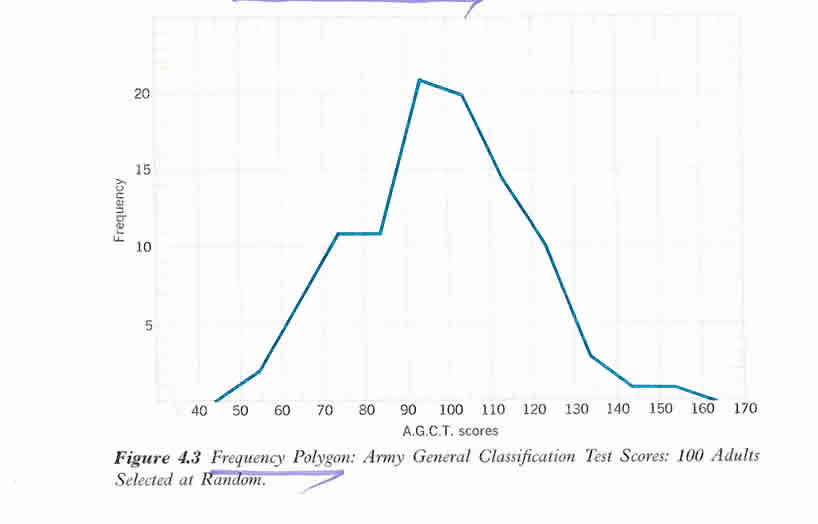
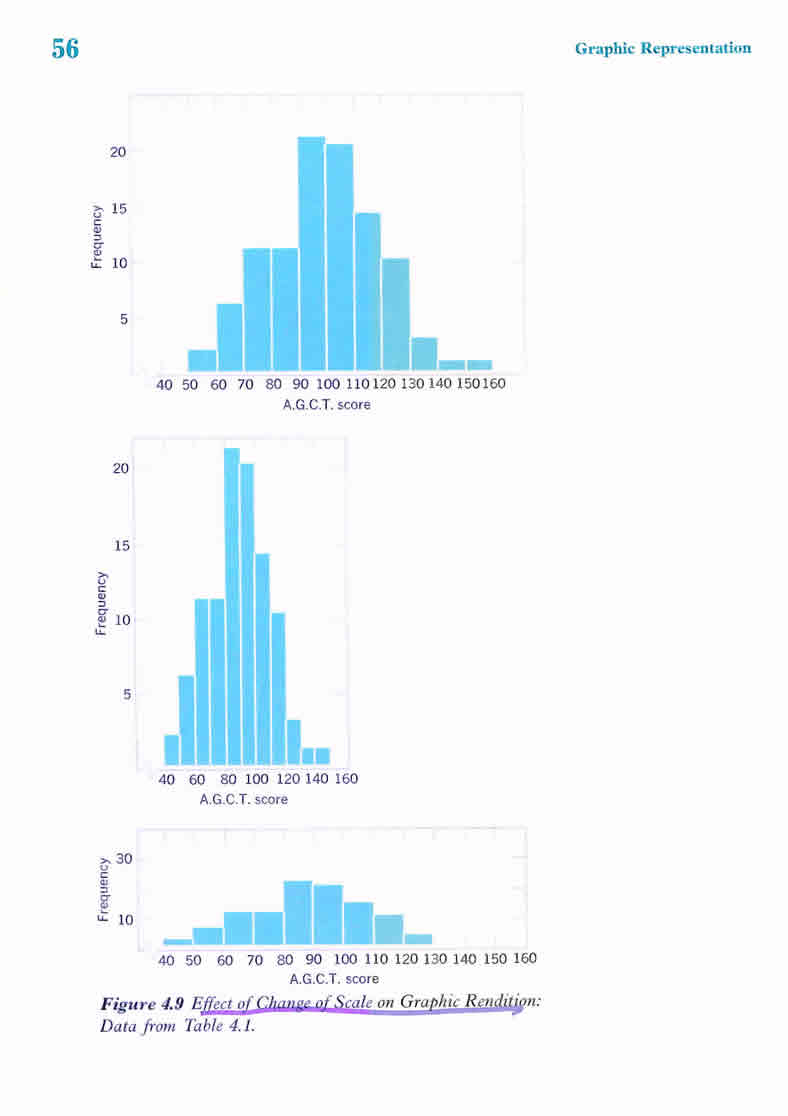
Army General Test Scores of 100 adults selected randomly

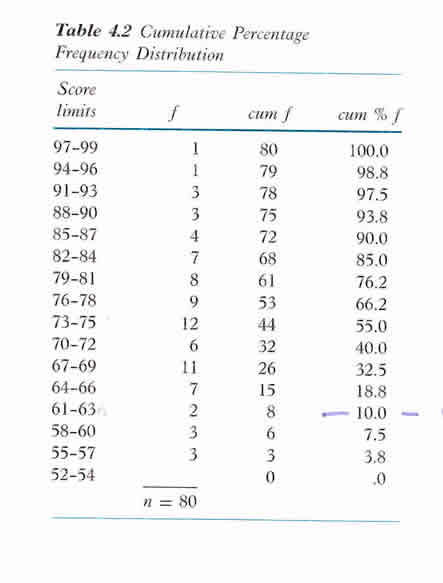
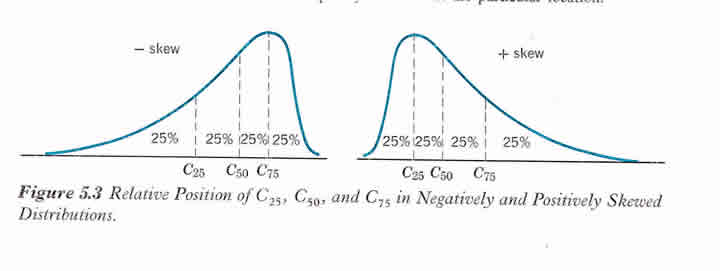
Distribution for Percentage and Percentile Rank example
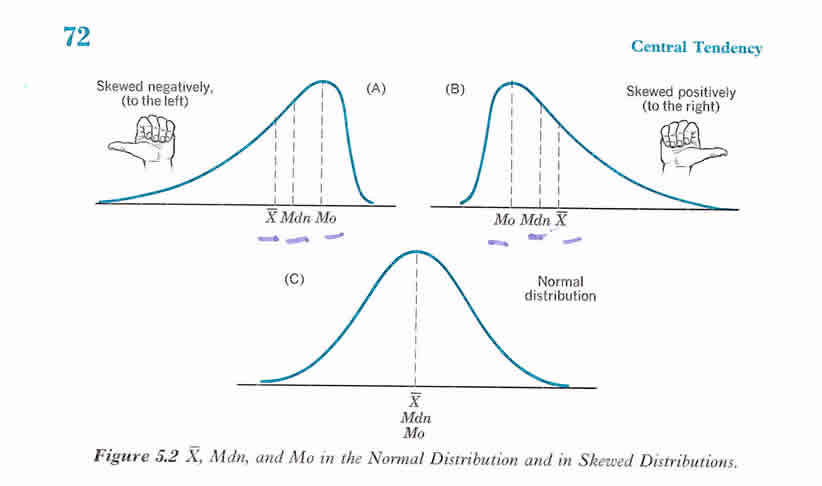
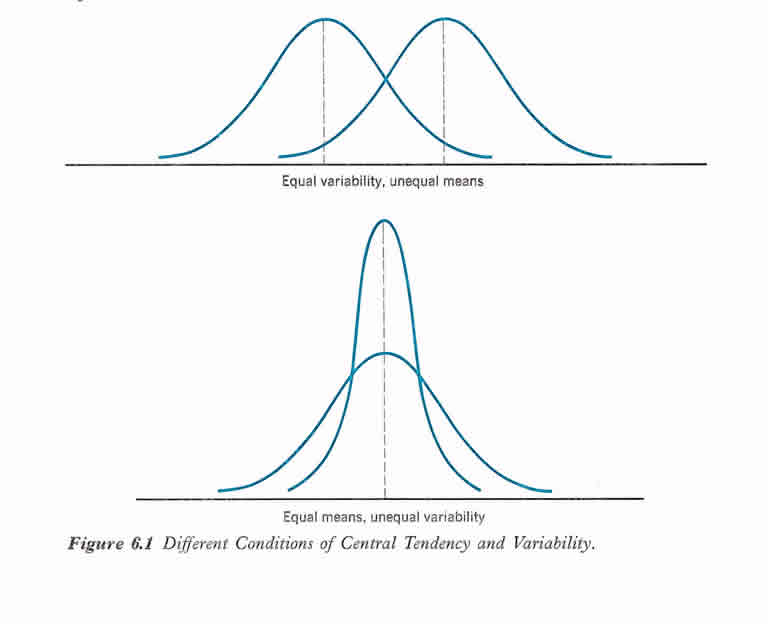
Central Tendency
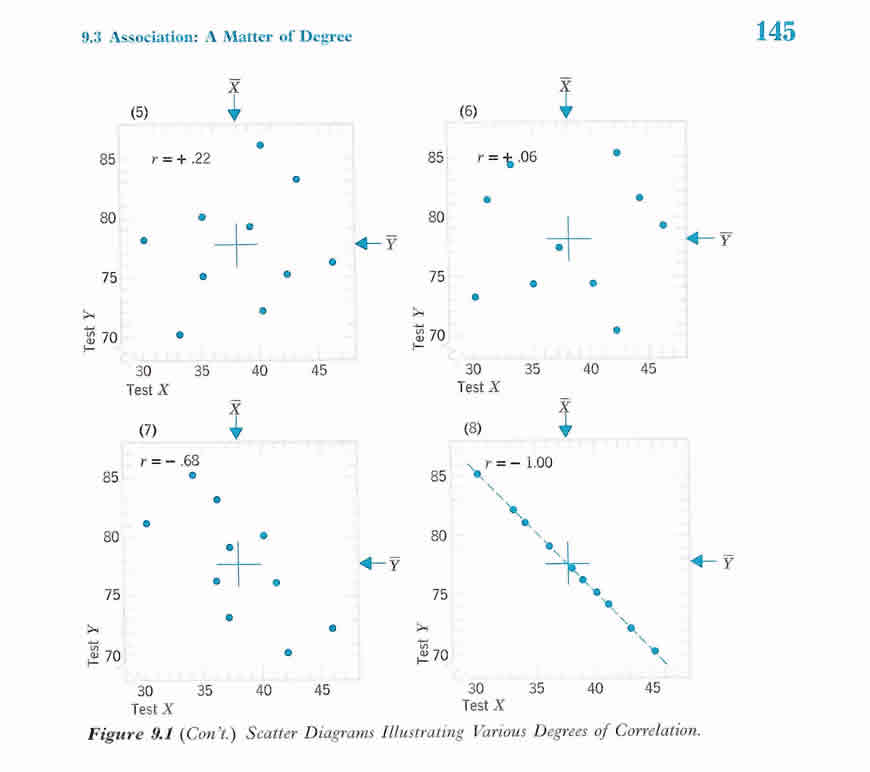
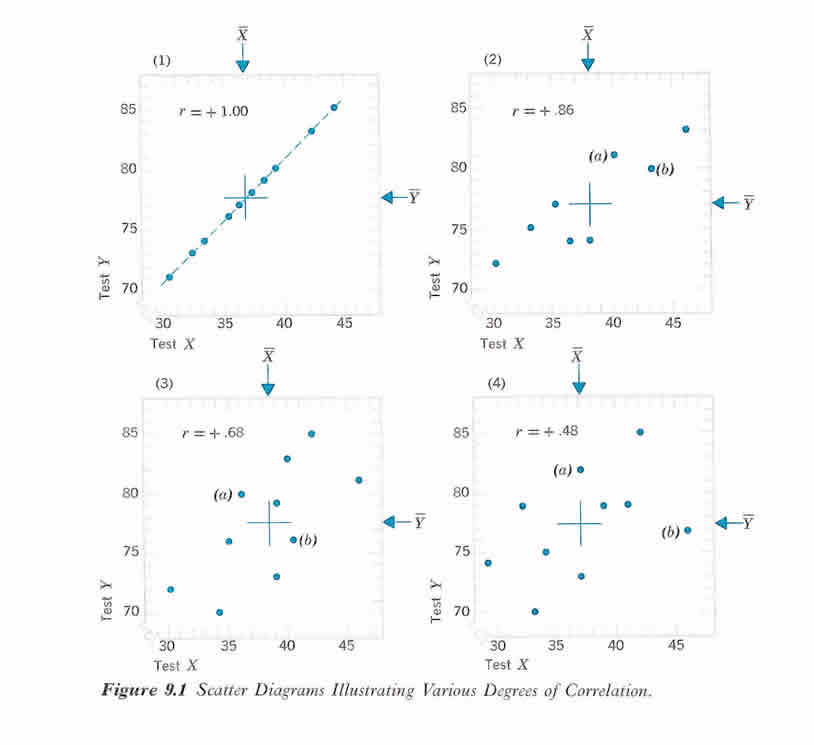
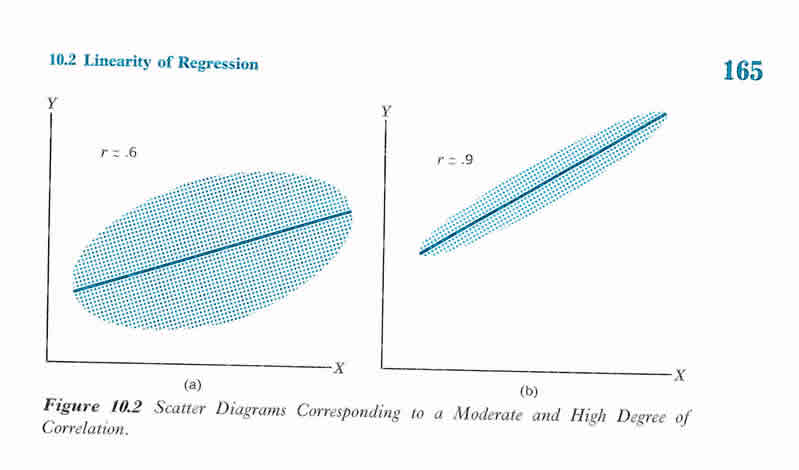
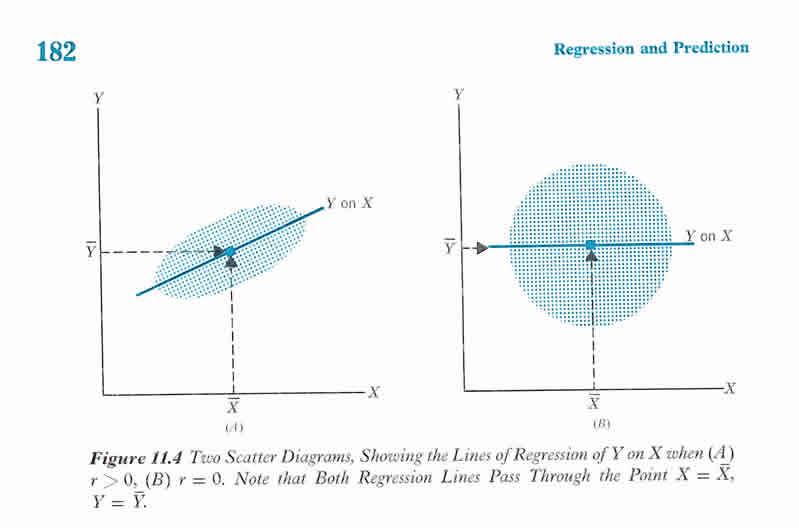
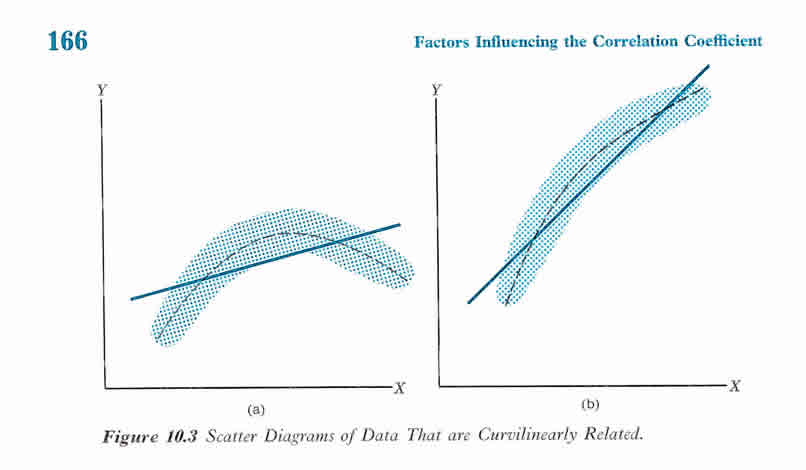
Correlation